
《K-Wolf》
High-Profit Gold Managed System

You can never earn beyond your level of understanding
Recognize the market timely and reasonably; clear and logical thinking leads to profits.
Introduction:
The K-Wolf High-Profit Quantitative System is an intelligent trading strategy that integrates quantitative trading, manual assistance, and big data filtering. The strategy executes trades in both directions, allowing for the capture of both upward and downward market movements, thus enhancing profitability. The trading model starts with a 0.01 lot size. For a $50,000 account, it can generate a monthly profit of 30-75% under average market conditions, with the potential to double the account in half a month. Conservative operation can reduce risk within a week, greatly increasing the probability of doubling the account within the month.
Table of Contents:
1. K-Wolf Strategy Activation Conditions
2. K-Wolf Underlying Logic Analysis
3. K-Wolf Profitability Overview
4. K-Wolf Risk Control System
5. Why Choose This Strategy?
6. Conclusion
1. K-Wolf Strategy Activation Conditions
Partner Platforms: Hantec, TMGM, DBG, Dooprime, ZFX, XM,etc.
2. K-Wolf Underlying Logic Analysis
In a highly probable and controllable range-bound market, the system opens positions with a 0.01 lot size in both long and short directions. The strategy involves selling high and buying low within the range, with delayed trend-following position increases during the trend. The system is designed to automatically generate profits within the set range with appropriate and sufficient capital. A long bearish candlestick often has a high probability of recovering to complete a profitable uptrend.
The system is applicable over a long cycle and can avoid extreme unilateral market conditions. It is resilient under pressure, with profitability based on market volatility and algorithmic trading. The system automatically adjusts the distance between and the multiplier for position increases, allowing for pre-calculated gains and drawdowns. This suggests that from a mathematical perspective, financial markets can be measured.
Example: RMB Exchange Rate Fluctuations:
From November 1, 2020, to February 21, 2022, according to historical exchange rate data from the People's Bank of China, the RMB fluctuated between 6.30297 to 6.59037 to the USD over 477 days. Suppose on June 1, 2021, a detailed mathematical logic algorithm was set based on the fluctuation range. By strictly adhering to the trading plan and executing position increases within this range, continuous profits could have been made over the next 265 days.
Due to changes in global geopolitics and the Federal Reserve's interest rate hikes, the RMB later surged past 6.6, almost reaching 7.37 in a straight upward trajectory—a historic high! Since September 16, 2022, after a series of sharp unilateral rises, the RMB has entered another range-bound cycle, fluctuating between 6.9648 to 7.3747 to the USD.
Key Insights:
Once a trend is broken, risk control and stop-loss measures must be taken promptly. Otherwise, it could lead to significant losses.
Position increases in highly probable ranges are key to profitability. Avoid gambling on rebounds in a strong unilateral market, but capitalize on momentary increases within a controllable range for higher profits.
The correlation between exchange rates and precious metals is extremely high and highly similar. Many forex transactions involve leverage because of their stability. Once a unilateral trend ends, a new favorable range will emerge, providing the best entry point.
Retaining 90% of profits while subtracting a 10% risk control range can still result in capturing 80% of the market's profits. A long-term stable "Holy Grail" strategy involves:
Holy Grail = (Profit - Risk Control Value) *High-Probability Profit Ranges + Manual Risk Control
3. K-Wolf Profitability Overview
Each trade aims for a profit of $12-$20 before closing and starting the next round. The profit-loss ratio stabilizes at a 3.3 threshold. Historical data shows that the account's position increases and floating losses are balanced at a 1:1.2 ratio. A PAMM system with $50,000 capital can achieve an average monthly return of 30-75%.
Examples:
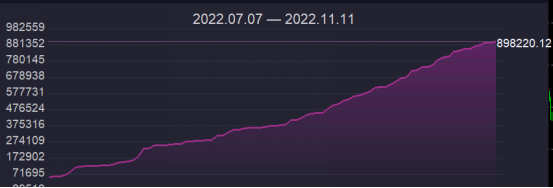
· July 7 to November 4: $50,000 principal increased to $900,000.
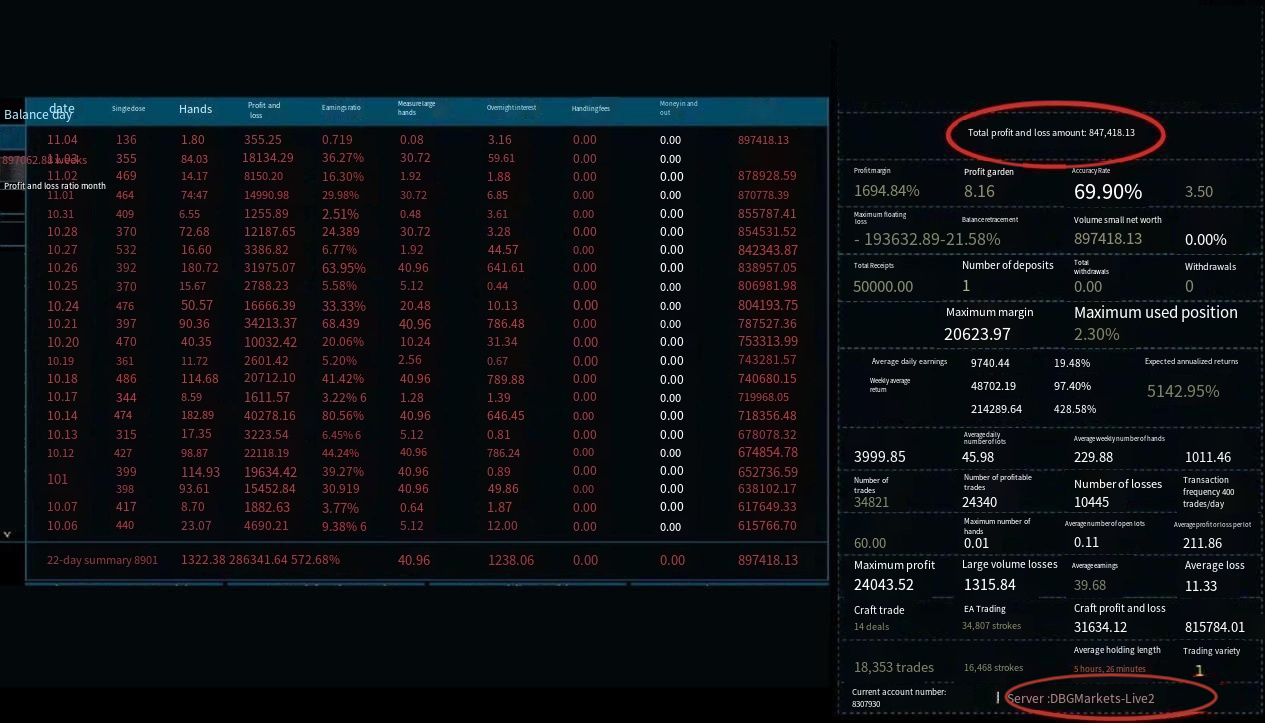
· October 27 to November 10: $40,000 profit over 11 trading days, increasing $50,000 to $90,000.
4. K-Wolf Risk Control System
1.Economic Data & Geopolitical Risk Control: Most unilateral market movements result from the periodic release of economic data such as CPI, Non-Farm Payrolls, and Federal Reserve rate hikes. Manual intervention can avoid unpredictable large-scale risks, ensuring that only well-assessed opportunities are pursued.
2.Delayed Moving Average Suppression—Avoiding Extreme Unilateral Rises: For instance, during the U.S. midterm elections, international gold surged by $40 due to safe-haven sentiment. The system refrained from position increases during a sharp $30 rise in just 10 minutes.
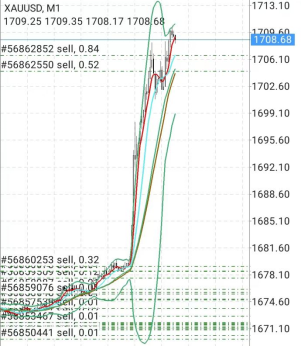
3.Even after a $40 unilateral surge, positions remained largely unchanged, with minimal floating losses. This was achieved through delayed moving average suppression, which halts operations during black swan events, thus avoiding adverse outcomes from indiscriminate position increases.
4.Platform Environment Testing Safeguards: The system often places 0.01 lot orders evenly distributed across the market. For a $50,000 account, relying on such small orders may seem slow, but this strategy ensures that platform errors don't misjudge entry and exit timing. The system incorporates a trading volume detection module that monitors platform stability and switches servers if necessary to prevent misjudgments.
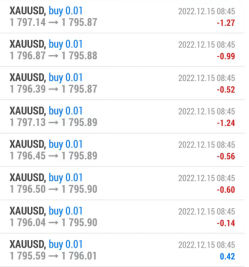

Current Spot Gold Market Situation: The following data, based on historical trading curves, offers a probability range that can be independently verified.
· 80% of the time: The market is in a range-bound state, fluctuating between $20 and $50, often due to technical adjustments, institutional funds entering the market, or minor economic data.
· 20% of the time: The market experiences a unilateral trend, with irreversible movements typically between $50 and $70, often due to geopolitical factors or major economic data releases.
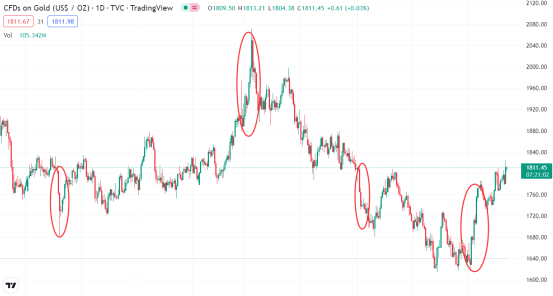
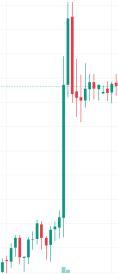
Unilateral Trends:
1. Short-Term Violent Rise of $50: Sudden sharp increase, often triggered by unexpected events.
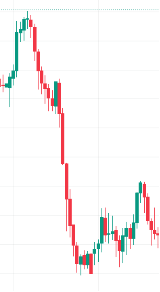
2. Slow Decline of $50: Gradual downward movement without a rebound, typically predictable through scheduled data releases or geopolitical shifts.
The K-Wolf Quantitative System is a comprehensive intelligent trading strategy that combines quantitative trading, manual assistance, big data filtering, multi-module detection, and delayed decision-making mechanisms. From a long-term operational perspective, it is crucial to leverage the appropriate methods in higher probability ranges and avoid markets that exceed these ranges. This strategy is designed for long-term profitability with an objective and sustainable capital curve.